Table of Contents
cs19f22as08: Graphing a PCM Waveform
Goals
- Work with explicitly binary data in C++.
- Learn a bit about digital audio representation.
Prerequisites
This assignment requires familiarity with the lecture materials presented in class through week 08.
Background
Review the discussion in lecture regarding PCM (pulse-code modulation) and its use in representing digital audio.
Assignment
You shall write a C++ program that accepts two command-line arguments specifying the width and height of an image and interprets the contents of standard input as a stream of raw (binary) 16-bit integer PCM audio samples (such as those emitted by week 08's pcm_generator example) and emits on standard output a sequence of 8-bit grayscale pixel values representing a width×height-pixel image (similar to week 08's grayscale_pixels example) on which the PCM waveform has been plotted as white pixels against a black background.
Assume any amount of input samples on stdin in native byte order1), and make sure that the image consists of a plot of the entire audio waveform:
- On the x axis, ensure that the left end of the image represents the first audio sample and the right end of the image represents the last audio sample, interpolating the horizontal position of all other samples by rounding to the nearest pixel along the image width.
- On the y axis, ensure that the top of the image represents a 16-bit sample with the maximum possible value (32767), and the bottom of the image represents a sample with the minimum possible value (-32768), interpolating all other possible sample values by rounding to the nearest pixel along the image height.
- Always round any calculations to the nearest pixel using
doubleprecision.
Ensure that the waveform is visible by drawing a “bounding box” around each plotted sample, i.e. color the pixels a certain distance around the plotted sample as well as the sample itself. The distance shall be:
$$ 2 \cdot \frac{\text{image width}}{\text{total # of samples}} $$
Constrain the bounding-box distance such that it is no fewer than 2 pixels and no greater than $\frac{\text{image height}}{16}$ pixels.
Tips
Since iostream (and C++ generally) uses char arrays to represent raw binary data (a char is always 1 byte), you will need to read and write char arrays. To interpret the input as 16-bit signed integer PCM samples, you can simply reinterpret a char array as an array of signed 16-bit integers:
[cling]$ #include <cstdint>
[cling]$ char raw_bytes[] = {'\xff', '\x7f', '\x01', '\x00'};
[cling]$ int16_t *samples = reinterpret_cast<int16_t *>(raw_bytes);
[cling]$ samples[0]
(short) 32767
[cling]$ samples[1]
(short) 1
Since you will be calling read() on std::cin, you may find function std::istream::gcount() useful, since it will tell you how many bytes were actually extracted:
[cling]$ char buf[1024];
[cling]$ std::cin.read(buf, 1024);
Hello!
[cling]$ std::cin.gcount()
(long) 7
Demonstration and Sample Executable
Sample executable cs19_pcm_waveform demonstrates the expected behavior of your program, and executable cs19_pcm_generator is a slightly fancier and configurable version of week 08's pcm_generator example (though by default it behaves the same). You can combine these with the convert command to generate actual image files. pcm_waveform also prints to stderr the total number of samples received and the resulting size of the bounding box, for testing purposes (you don't have to include this in your program).
cs19_pcm_generator accepts two optional command-line arguments:
- A maximum positive amplitude for the wave, i.e. an integer expected to be < 32767 (defaults to 25000 if unspecified)
- A type of waveform, specifically either
sine(the default if unspecified),square,triangleorsawtooth(see image on the right)
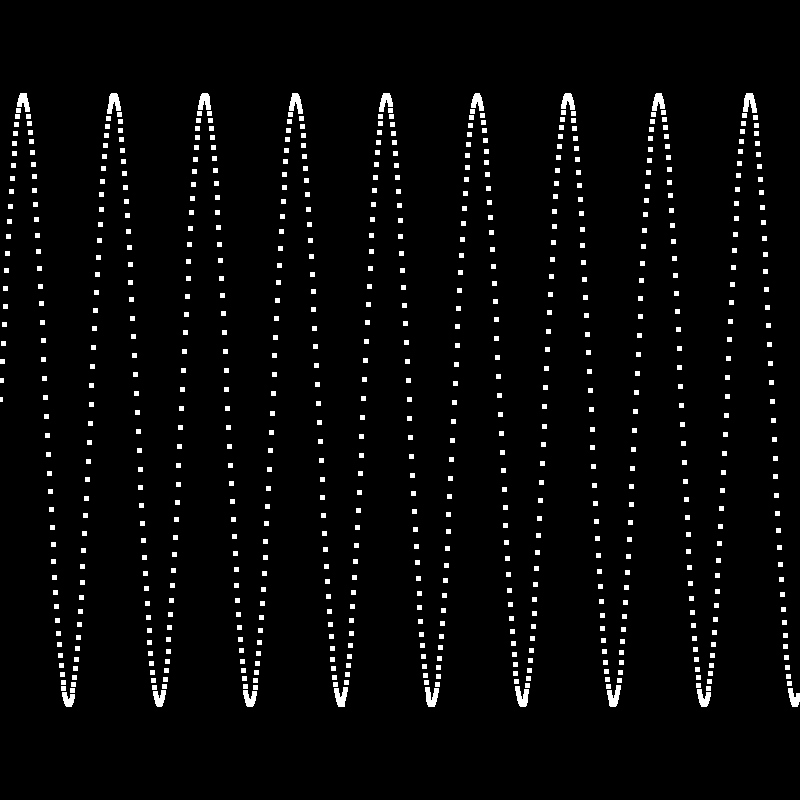
For example, the following command will generate a 1 second of a 4 Hz sine wave, so if we graph it we should see pretty much exactly 4 wave periods spread across the entire image:
cs19_pcm_generator <<< '4 1' |
  cs19_pcm_waveform 8192 512 |
  convert -depth 8 -size 8192x512 gray:- ~/public_html/as08.png
If you run the above command, you should see the following image at URL jeff.cis.cabrillo.edu/~/as08.png:
Here are some other commands and their expected images:
cs19_pcm_generator <<< '20 .1 200 .1 400 .1' |
  cs19_pcm_waveform 17280 1080 |
  convert -depth 8 -size 17280x1080 gray:- ~/public_html/as08.png
cs19_pcm_generator <<< '440 .02' |
  cs19_pcm_waveform 800 800 |
  convert -depth 8 -size 800x800 gray:- ~/public_html/as08.png
cs19_pcm_generator 10000 sine <<< '196 .25 392.63 .25 261.63 .25' |
  cs19_pcm_waveform 8192 512 |
  convert -depth 8 -size 8192x512 gray:- ~/public_html/as08.png
cs19_pcm_generator 10000 square <<< '196 .25 392.63 .25 261.63 .25' |
  cs19_pcm_waveform 8192 512 |
  convert -depth 8 -size 8192x512 gray:- ~/public_html/as08.png
cs19_pcm_generator 10000 triangle <<< '196 .25 392.63 .25 261.63 .25' |
  cs19_pcm_waveform 8192 512 |
  convert -depth 8 -size 8192x512 gray:- ~/public_html/as08.png
cs19_pcm_generator 10000 sawtooth <<< '196 .25 392.63 .25 261.63 .25' |
  cs19_pcm_waveform 8192 512 |
  convert -depth 8 -size 8192x512 gray:- ~/public_html/as08.png
Leaderboard
As submissions are received, this leaderboard will be updated with the top-performing fully/nearly functional solutions, with regard to execution speed.
| Rank | Test Time (s) | Memory Usage (kB) | SLOC (lines) | User |
|---|
Submission
Submit your source-code file(s) via turnin. If you submit multiple files, make sure there is only one main() function defined.
 Feedback Robot
This project has a feedback robot that will run some tests on your submission and provide you with a feedback report via email within roughly one minute.
Please read the feedback carefully.
Due Date and Point Value
Due at 23:59:59 on the date listed on the syllabus.
Assignment 08 is worth 60 points.
Possible point values per category:
---------------------------------------
Precision of waveform                60
Possible deductions:
  Style and practices            10–20%
Possible extra credit:
  Submission via Git                 5%
---------------------------------------


